The product provides up to date wave conditions around Australia, with data gathered from Australia’s coastal wave buoy network, several satellites and the Bureau of Meteorology’s AUSWAVE-R model.
The new product, 2-hourly maps of surface waves, is added to the suite of visualisations already available on the IMOS OceanCurrent website. The new maps present a combination of near real-time wave information from Australia’s in-situ wave buoy network, several satellite platforms (radar altimeter and Synthetic Aperture Radar (SAR) missions), and the near real-time modelled wave field from the Australian Bureau of Meteorology’s (BoM) AUSWAVE-R model. This combined spatial representation of modelled, in-situ, and satellite data complements buoy data time-series available from the State and Commonwealth agencies that operate each buoy. Each operator’s buoy data page can be accessed by clicking on the buoy location on the maps.
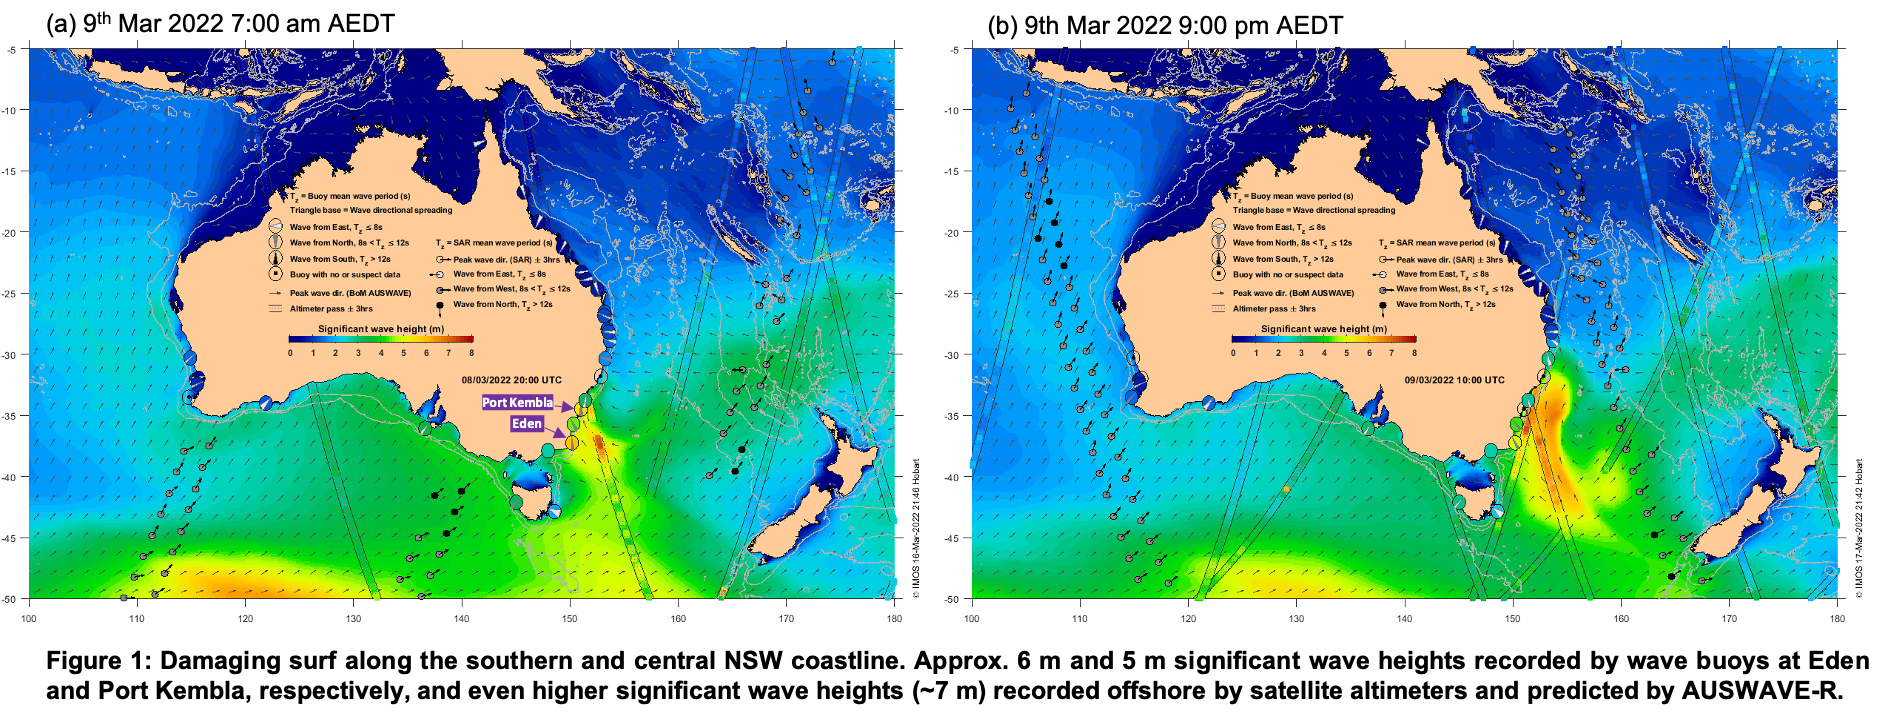
High seas contributing to the recent significant NSW coastal erosion event, following weeks of intense storms and severe weather, were well captured in the new IMOS-OceanCurrent surface waves product (Figure 1). The BOM-NSW issued a severe weather warning on 9th Mar 2022 for damaging surf on the central and southern parts of the NSW coast (Figure 2), following the high waves generated from a low-pressure system/east coast low in the Tasman Sea. Significant wave heights of 5-6 m were recorded by wave buoys at Eden and Port Kembla (Figure 1a, purple arrows). Offshore, the low-pressure system generated even higher wave – heights up to 7 m – as observed by satellite altimeter passes and predicted by BoM’s AUSWAVE-R model (Figure 1b). Note that buoy measurements nearest in time and all available satellite passes within +/- 3 hours of the background AUSWAVE-R wave field are displayed. The 6-hour window allows sufficient buoy measurements and satellite passes to be available for spatial display with the caveat that some loss of agreement of wave information between various data sources can be expected. The maps also include the mean wave periods and peak wave direction of the longer swell waves from Sentinel-1 SAR passes (black, white, and grey circles). However, none of these passes coincided over the region of interest to be useful in this event.
The IMOS-OceanCurrent wave product has been made possible thanks to provision of wave data from several sources including State and Commonwealth Government wave buoy custodians, sourced through IMOS Australian Ocean Data Network (AODN) National wave buoy data archive, satellite altimeter wave height data from RADS, Sentinel-1 near real time SAR wave data from IMOS-AODN, and BoM’s AUSWAVE-R background wave field.
The latency of all these datasets is variable, but usually less than 24 hours. For a forecast of surface wave height, please refer to the BOM’s website.