
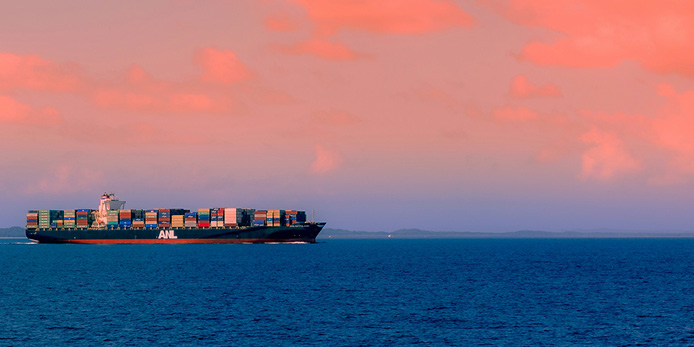
Australia’s waters host some of the busiest shipping routes in the southern hemisphere, with thousands of vessels moving through coastal and offshore regions each year. The Australian Maritime Safety Authority (AMSA) captures this activity through its national Automatic Identification System (AIS) network, generating a vast dataset of vessel movements, now exceeding 200 million records.
Despite its scale and importance, this data has historically been difficult to access and analyse for environmental assessments and marine planning.
Through the NESP Marine and Coastal Hub project, IMOS data engineers have transformed this complex dataset into a cloud-optimised, analysis-ready resource. The enhanced dataset is structured using spatiotemporal partitioning, allowing users to efficiently query specific regions, vessel types or time periods without needing to download or process the entire archive.
Each record includes an H3 hexagonal spatial index, allowing straightforward aggregation of vessel activity at different spatial scales, from local reef systems to entire ocean regions, without the need for complex geometric operations. This makes it straightforward to characterise shipping intensity across ecologically sensitive areas, from the Great Barrier Reef to remote Commonwealth Marine Reserves, and to track trends over time in a format directly compatible with State of the Environment reporting and the Nature Positive Plan.
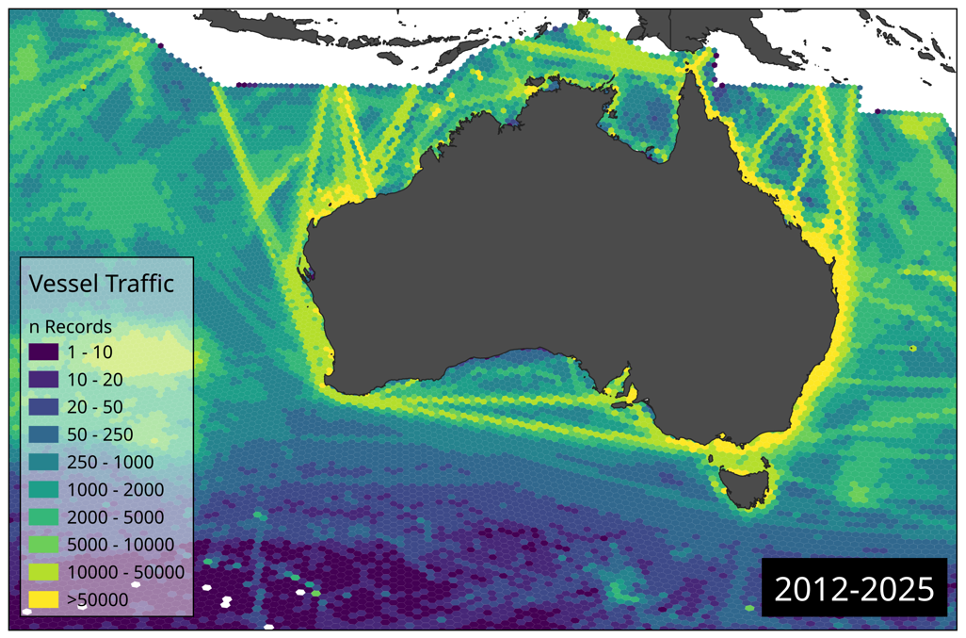
Vessel traffic density around Australia aggregated over the period 2012–2025, derived from AMSA Automatic Identification System (AIS) records. Each hexagonal cell represents an H3 spatial unit of about 1,700 km², with colour indicating the number of AIS pings recorded per cell across the full time series — from sparse detections (dark purple) to heavily trafficked corridors exceeding 50,000 records (yellow). Major shipping lanes are clearly visible as high-density corridors hugging the coastline and crossing the open ocean, reflecting the intensity of maritime activity in Australian waters. This aggregated view exemplifies the multi-scale spatial analysis enabled by the H3 indexing embedded in every record of the assessment-ready dataset.
The dataset is available through the AODN Portal, and is also available for direct cloud access at s3://data-uplift-public/stored/datauplift/amsa/ enabling efficient querying without the need to download the full archive.
To help users get started, IMOS has developed step-by-step workflows in both Python and R, including how to connect directly to the S3 collection using the appropriate tools. We have also created companion video tutorials, which guide users through data access, processing and analysis.
Together, these resources lower the barrier to entry for researchers, managers, and policy analysts looking to make the most of this nationally significant dataset.
This work improves access to vessel traffic data, supporting its use in environmental assessments, and marine planning and reporting.