A newly added feature to the IMOS OceanCurrent Surface Wave maps enables users to visualise and examine time series of wave characteristics collected by buoys contributing to the national wave archive.
To access the data, users simply click on a wave buoy symbol on the map. There is also the functionality to navigate forward or backward in two-hourly increments and share a permanent URL of a time series plot.
This feature is particularly useful during wave extremes as highlighted in the recent weather events in Southern Australia.
In August and September relentless westerlies in Southern Australia caused widespread disruption and damage in Tasmania and Victoria. The Tasmanian West coast has seen persistently high waves during these extremes.
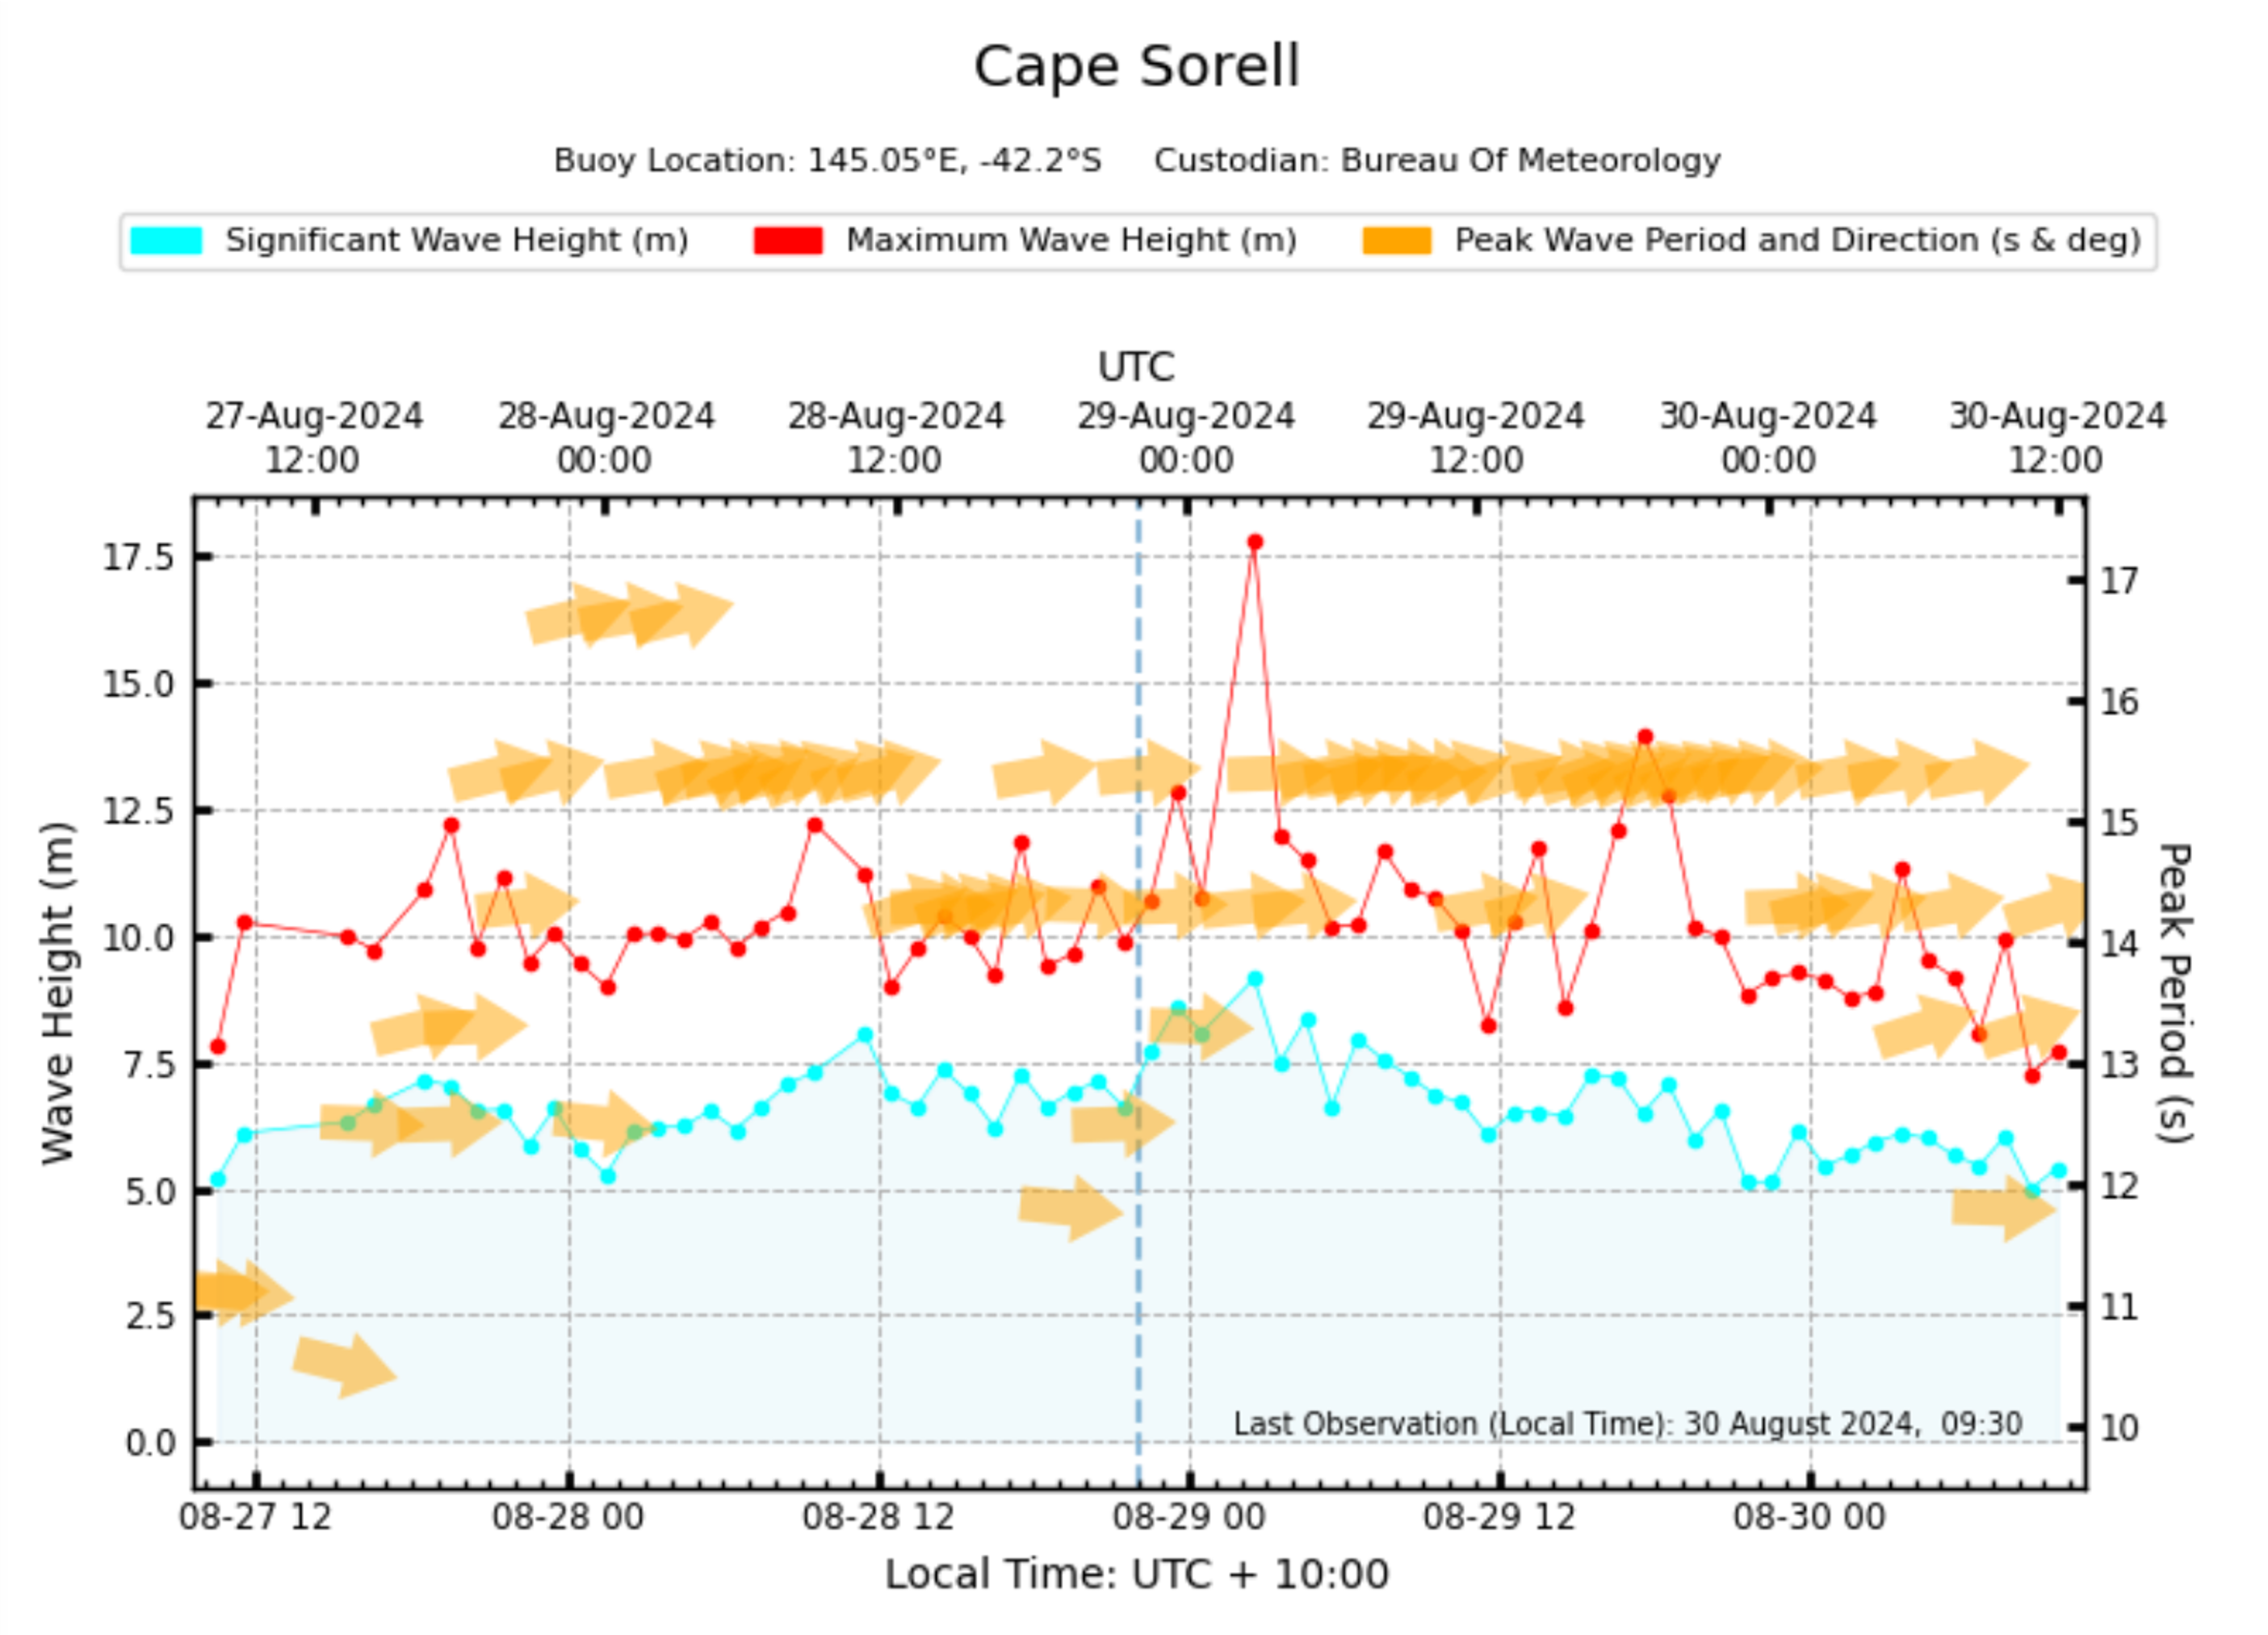
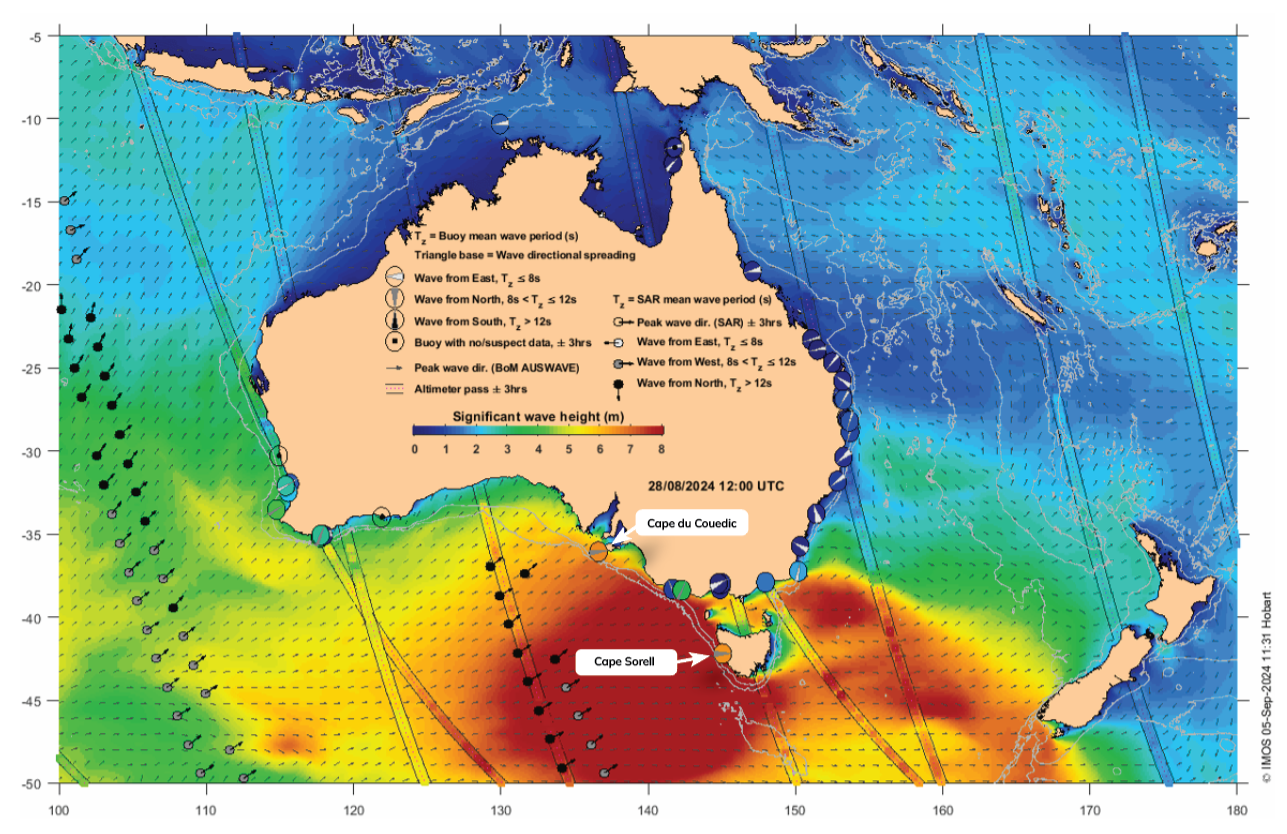
The Cape Sorell buoy (145E, 42S) recorded significant wave heights close to 8m over a few days over this period and even recorded an individual wave as high as ~18m – about the height of a 6-storey building (Figure 2). The wave buoys at Cape Sorell and Cape du Couedic (Southwest of Kangaroo Island) captured significant wave heights upwards of 7m on 28th Aug (Figure 1).