The highest spatial resolution (1.1 km x 1.1 km) data from Advanced Very High Resolution Radiometer (AVHRR) sensors on NOAA Polar-orbiting Operational Environmental Satellites (POES) can only be obtained through receiving direct broadcast High Resolution Picture Transmission (HRPT) data from the satellite. The Bureau of Meteorology, in collaboration with CSIRO Oceans and Atmosphere Flagship, combines raw HRPT data from reception stations located in Australia and Antarctica and produces real-time, level 2 (geolocated, swath) and level 3 (gridded, composite) files containing either “skin” (~ 10 micron depth) or “foundation” (~ 10 m depth) SSTs.
All files follow the latest International Group for High Resolution Sea Surface Temperature (GHRSST) “GDS 2” file formats. The IMOS SST processing system aims to provide a consistent, accurate record of SST over an extended period of time from AVHRR sensors on all operational NOAA POES satellites from NOAA-11 to NOAA-19. The SST values are derived by regressing the brightness temperature observations from the satellite sensor against collocated drifting buoy SST observations. The system smoothly and automatically corrects for changes in each sensor’s bias using a running one year calibration window, adjusted monthly (Griffin et al., 2017).
See how to read the data in the ‘Useful Information’ section at the bottom of this page. Here, you can also find more details about the variables in the files.
Advantages
There are several advantages to using the IMOS-GHRSST format SST products. Quality level flags and error information enable users to tailor the SST data for their particular research application by trading spatial coverage for accuracy and vice versa. Users have the ability to <link typo3>access the GHRSST-format gridded SST products through IMOS OPeNDAP servers, greatly simplifying data access and extraction. In addition, each GHRSST file netCDF header contains very comprehensive metadata information.
For each SST value the GHRSST files contain a quality level flag (“quality_level”), bias and standard deviation error estimates (“sses_bias” and “sses_standard_deviation”) and flags (“l2p_flag”). See ‘Useful Information’ at the bottom of the page for file field definitions. The quality level (0, 1, …, 5) is based solely on the SST pixel’s proximity to cloud in kilometres, and is therefore a measure of the amount of cloud contamination expected. Best quality pixels (quality_level = 5) are at least 5 km horizontally from the nearest detected cloud. In the IMOS SST processing system, the bias and standard deviation estimates for each SST value are a smoothly varying function of satellite zenith angle, time of day, geographic location and quality level, calculated using a rolling one year window of match-ups with drifting buoy SST data, adjusted approximately every 5 days. The l2p_flags can be used to filter the data for land, high aerosol content, high or low winds, etc, and are described in each file header.
Further details
For further details on the AVHRR IMOS-GHRSST products and processing methods see Paltoglou et al. (2010) and Beggs et al. (2013) Section 4 and Griffin et al. (2017). References are available in the ‘Useful Information’ section at the bottom of this page.
The following IMOS GHRSST “GDS 2” format files are produced in netCDF4 format using the Australian HRPT AVHRR SST data over the Australian domain (70°E to 190°E, 70°S to 20°N) and have been reprocessed back to 1992:
L3C: Single sensor, multiple swath, gridded SSTskin at 0.02° x 0.02° resolution, averaged over 1 and 3 days (used for diurnal warming research, e.g. TWP+ Project)
L3S: Multiple sensors, multiple swath, day-only or night-only SSTskin and day+night foundation SST (SSTfnd), gridded at 0.02° x 0.02° resolution and averaged over multiple days (1, 3, 6, 14 and 1 month) (used for ReefTemp NextGen, IMOS OceanCurrent and marine biological research).
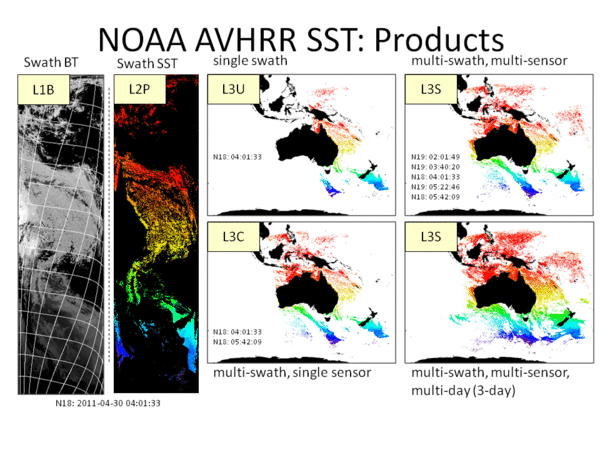
The two graphics at right explain the various IMOS GHRSST products.
Examples of the various different types of Australian domain IMOS GHRSST-format products from locally received AVHRR SST data.
A graphical representation of how different day or night swath data are combined from multiple satellites to produce the various GHRSST SST products (L2P, L3U, L3C and L3S).
Multiple swath L3C and L3S products produced using only day-time data are stored in the “day” directories, night-time data in the “night” directories and day and night data in the “dn” directories. Please note that the ghrsst_fv01 directory contains the “fv01” version of the IMOS HRPT AVHRR SST products as documented in Paltoglou et al. (2010) and reprocessed back to 1998 using data from NOAA-15 to NOAA-19 satellites. These files are currently available up to real-time. The ghrsst_fv02 directory contains the fv02 version of the products as documented in Beggs et al. (2013) and Griffin et al. (2017). The fv02 products have been reprocessed back to 1992 using data from NOAA-11 to NOAA-19 satellites. The fv02 files represent a more complete data record than fv01 and use different algorithms to convert from AVHRR brightness temperatures to SST values (Griffin et al., 2017). It is expected that the fv02 products will be produced operationally in real-time at the Bureau of Meteorology in 2015. The ghrsst directory contains all fv02 files up to 31 December 2014 and fv01 files after that date.
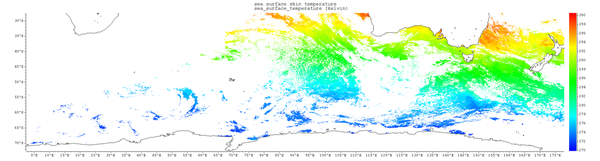
Example of a Southern Ocean domain IMOS GHRSST-format product
Some additional products (SST and Ocean Colour) are available through the THREDDS catalogue maintained by CSIRO.
Useful information
Data validation
The real-time (fv01) and reprocessed (fv02) IMOS satellite SST L2P, L3U, L3C and L3S products are routinely validated using collocated in situ SST observations.
The following steps are recommended in order to derive the most appropriate SST values for your application from IMOS L2P, L3U, L3C or L3S files:
1. Check for valid SST value
If for a particular pixel or grid cell the sea_surface_temperature:_FillValue = -32768 then the SST value is either missing, invalid or the pixel is considered to be covered by land or ice. No other variables for this pixel will be valid.
2. Convert SST from integer to floating point (Kelvin)
To obtain floating point SST values in Kelvin from the valid sea_surface_temperature integer count values in the GHRSST format files apply:
SST (in Kelvin) = sea_surface_temperature x sea_surface_temperature:scale_factor + sea_surface_temperature:add_offset.
3.Convert bias and standard deviation from signed byte to floating point (Kelvin)
Bias (in Kelvin) = sses_bias x sses_bias:scale_factor + sses_bias:add_offset
Standard Deviation (in Kelvin) = sses_standard_deviation x sses_standard_deviation:scale_factor + sses_standard_deviation:add_offset
WARNING: Some applications (eg. IDL) are unable to properly handle signed byte values. If byte values >127 are encountered, subtract 256 from this reported value to produce the correct integer value. See ftp://mariana.jpl.nasa.gov/mur_sst/tmchin/software/idl/IMOS/ for example IDL code to read GDS 2.0 format L2P, L3U, L3C and L3S files.
4. Correct for biases in the SST measurements
To reduce the effect from short-term changes in the atmosphere and AVHRR sensor, it is recommended that the user subtract the bias from the SST value (in Kelvin) for each pixel or grid cell.
De-biased SST = SST – Bias
5.If required, convert from skin to buoy depth temperatures
Users can convert the AVHRR skin SST product to a drifting buoy depth (~20 cm to 30 cm) temperature via the addition of 0.17°C.
If sea_surface_temperature:standard_name = “sea_surface_skin_temperature” then SSTdepth = SST + 0.17
The skin SST is valid at all wind speeds, but the conversion to buoy-depth SST is less accurate at low wind speeds (< 6 m/s during the daytime and < 2 m/s at night-time). Refer to Paltoglou et al (2010) at <link srsdoc.html>
Note that this step is not required for the foundation SST (“SSTfnd”) values as these have already been “calibrated” to drifting buoy depths and “converted” to an approximation of foundation SST by rejecting SST observations for collocated surface wind speeds < 6 m/s during the day and < 2 m/s during the night, thus eliminating those SST values most likely to have experienced diurnal warming.
6.Select the required quality level or error threshold
For the lowest probability of cloud contamination, select SST values where quality_level is 5. For greater spatial coverage, but still generally cloud-free pixels, select SST values for quality_level ≥ 3. Alternatively, if reducing systematic or random errors are important, select SST values for the required bias and standard deviation thresholds for your application.
7. Experimental Fields
There are several experimental fields in the fv02 version IMOS GHRSST netCDF files, designated by “EXPERIMENTAL FIELD” in the variable’s comment field. These include:
sea_surface_temperature_day_night: The skin sea surface temperature based on a unified day/night model aimed at reducing the bias between day and night observations
sses_quality_level: Quality based on the sensor specific error statistics (SSES), where a small value is higher quality.
Such fields require additional information to use effectively. Please contact ghrsst(at)bom.gov.au for guidance.
GHRSST fv02 file fields
sea_surface_temperature: The SST based on a non-linear retrieval scheme with separate day and night algorithms (Griffin et al., in prep.). The retrieval scheme is calculated monthly on a two year rolling window regression of observations against in situ measurements.
sea_surface_temperature_day_night: An optional SST based on a retrieval scheme which uses a single algorithm for both day and night processing (Griffin et al., in prep.), resulting in a consistent retrieval for both day and night. The SST thus retrieved is thus expected to be more suited to studies of the diurnal cycle. It is expected that when there is a large deviation between sea_surface_temperature and sea_surface_temperature_day_night during the day, that this corresponds to a transitory atmospheric condition. Large differences thus detected, of 3sses_standard_deviation or greater, result in a flag to be set in the l2p_flags field. The retrieval scheme is calculated monthly on a 2 year rolling window regression of observations against in situ measurements.
quality level: The pixel quality based on a measure of the distance to the nearest cloud in kilometers, or 5 if the distance is greater than 5 km. Pixel quality is assumed to be primarily driven by the degree of cloud contamination, so this forms the best first indication of the quality of a given pixel. Further indications of pixel quality can be garnered from l2p_flags, ancillary information, and the sses_bias and sses_standard_deviation which provide estimates of bias and error based on in situ measurements under similar view, quality and geographical conditions.
l2p_flags: Additional l2p_flags have been added to reflect various ancillary conditions. This allows decisions on data quality related to ancillary fields to be made by reading a bit array rather than processing the ancillary fields.
sses_count: A measure of the indicative number of degrees of measurements which went into validating or generating the SST measurement. For L2P files, this is an indication of the number of in situ measurements made under similar view, quality and geographical conditions. For L3U files, this is an indication of the number and proportion of L2P observed pixels that went into the composition of the gridded cell. For L3C and L3S files, this is an indication of the weighted number of degrees of freedom that contributed to the SST. Empirical degrees of freedom models are updated every five days and represent relatively high frequency changes in the condition of the SST retrieval.
sses_bias: An estimate of the bias of the measurement with respect to in situ measurements made under similar view, quality and geographical conditions. The sses_bias is empirically determined, and not based on regression with physically inspired SST retrieval models. However, addition of the bias does result in an overall more accurate match between retrieved SST and in situ measurements. sses_bias can be subtracted from the SST if this empirical compensation is required to be included in the assessment of the SST. sses_bias strictly is derived from sea_surface_temperature, and should not be blindly applied to sea_surface_temperature_day_night. Empirical bias models are updated every five days and represent relatively high frequency changes in the condition of the SST retrieval.
sses_standard_deviation: An indication of the uncertainty associated with the SST estimate, compared to in situ measurements made under similar view, quality and geographical conditions. The sses_standard_deviation is empirically determined, and not based on regression with physically inspired SST retrieval models. However, sses_standard_deviation can be compared to the sses_bias to give some idea about the confidence in using this as a correction to the SST. sses_standard_deviation strictly is derived from sea_surface_temperature, and thus will not directly apply to sea_surface_temperature_day_night, however, it may be used to determine the scale on which the difference between the two sea surface temperatures may show significant difference. Empirical standard deviation models are updated every five days and represent relatively high frequency changes in the condition of the SST retrieval.
sst_count: The unbiased number of SST observations that were merged into the pixel at this location. This field is not present in L2P files, and will be absent if all valid sst_count values are 1. This field is typically used in multi-day L3S over long periods of time, to correct SSES estimates.
sst_mean: The unbiased mean of the SST observations that were merged into the pixel. This field is not present in L2P files, and will be absent if sst_count is less than 2. This field is typically used in multiday L3S over long periods of time, to correct SSES estimates.
sst_standard_deviation: The unbiased standard deviation of the SST observations that were merged into the pixel. This field is not present in L2P files, and will be absent if all valid values are ill-defined because sst_count is less than 2. This field is typically used in multi-day L3S over long periods of time, to correct SSES estimates.
dt_analysis: The deviation between the SST sea_surface_temperature, and a level 4 analysis of the previous day’s foundation SST observations. For skin SST, the mean value of dt_analysis in a wind environment that encourages top level mixing, will be 0.17K. Prior to 23 July 2008, dt_analysis makes use of the NCDC SSTblend analysis (Reynolds et al., 2007). After 23 July 2008, GAMSSA foundation SST is used as the level 4 analysis (Zhong and Beggs, 2008).
wind_speed: The surface wind estimated from global numerical weather prediction models and interpolated in time and space to the location of the SST value. Prior to 1 September 2009, ECMWF historical re-analysis is used. After 1 September 2009, the Australian Bureau of Meteorology ACCESS-G analysis or forecast 10 m surface winds are used (Puri et al., 2010). Note that the model wind speeds are available on a much coarser spatial and temporal resolution than the SST observations and are included in the IMOS-GHRSST files for quality control purposes.
sea_ice_fraction: A number between zero and one, representing the sea-ice fraction, is taken from the NCEP sea ice analysis of the previous day.
aerosol_dynamic_indicator: After 27 November 1998 the Aerosol Dynamic Indicator (ADI) is added based on the NOAA AERO100 data set analysis based on the previous day. OS-DPD daily files are used after 11 January 2011. Early SST retrievals prior to 27 November 1998, may not contain ADI fields.
history: The history metadata contains much information about the history of the file during processing as well as the tools that processed the file and other status information that relates to the processing.
Zhang, Haifeng, Helen Beggs, Christopher Griffin and Pallavi Govekar. (2023) Validation of Himawari-8 Sea Surface Temperature Retrievals Using Infrared SST Autonomous Radiometer Measurements. Remote Sens. 2023, 15(11), 2841; https://doi.org/10.3390/rs15112841
Govekar, Pallavi, Christopher Griffin and Helen Beggs (2022) Multi-sensor Sea Surface Temperature products from the Australian Bureau of Meteorology, Remote Sensing, 2022, 14, 3785. (6 August 2022) https://doi.org/10.3390/rs14153785
Beggs, Helen and Pallavi Govekar (2022) Gridded Sea Surface Temperature Observations, Bureau of Meteorology Fact Sheet, Bureau of Meteorology, Docklands, Vic, Australia, 11th August 2022, 2 pp.
Beggs, Helen (2021). Temperature. Ch 14 in Earth Observation: Data, Processing and Applications. Volume 3B—Surface Waters. CRCSI, Melbourne. pp. 245–279. ISBN 978-0-6482278-5-4. https://www.eoa.org.au/earth-observation-textbooks
Wijffels, Susan E., Helen Beggs, Christopher Griffin, John F. Middleton, Madeleine Cahill, Edward King, Emlyn Jones, Ming Feng, Jessica A. Benthuysen, Craig R. Steinberg and Phil Sutton (2018) A fine spatial scale sea surface temperature atlas of the Australian regional seas (SSTAARS): seasonal variability and trends around Australasia and New Zealand revisited, J. Marine Systems, 187, 156-196. https://doi.org/10.1016/j.jmarsys.2018.07.005
Beggs H, L. Majewski, C. Griffin, R. Verein, P. Sakov, X. Huang, L. Garde and C. Tingwell (2013) Report to GHRSST14 from Australia – Bluelink and IMOS, In: Proceedings of the GHRSST XIV Science Team Meeting, Woods Hole, USA, 17 – 21 June 2013