Event Based Sampling
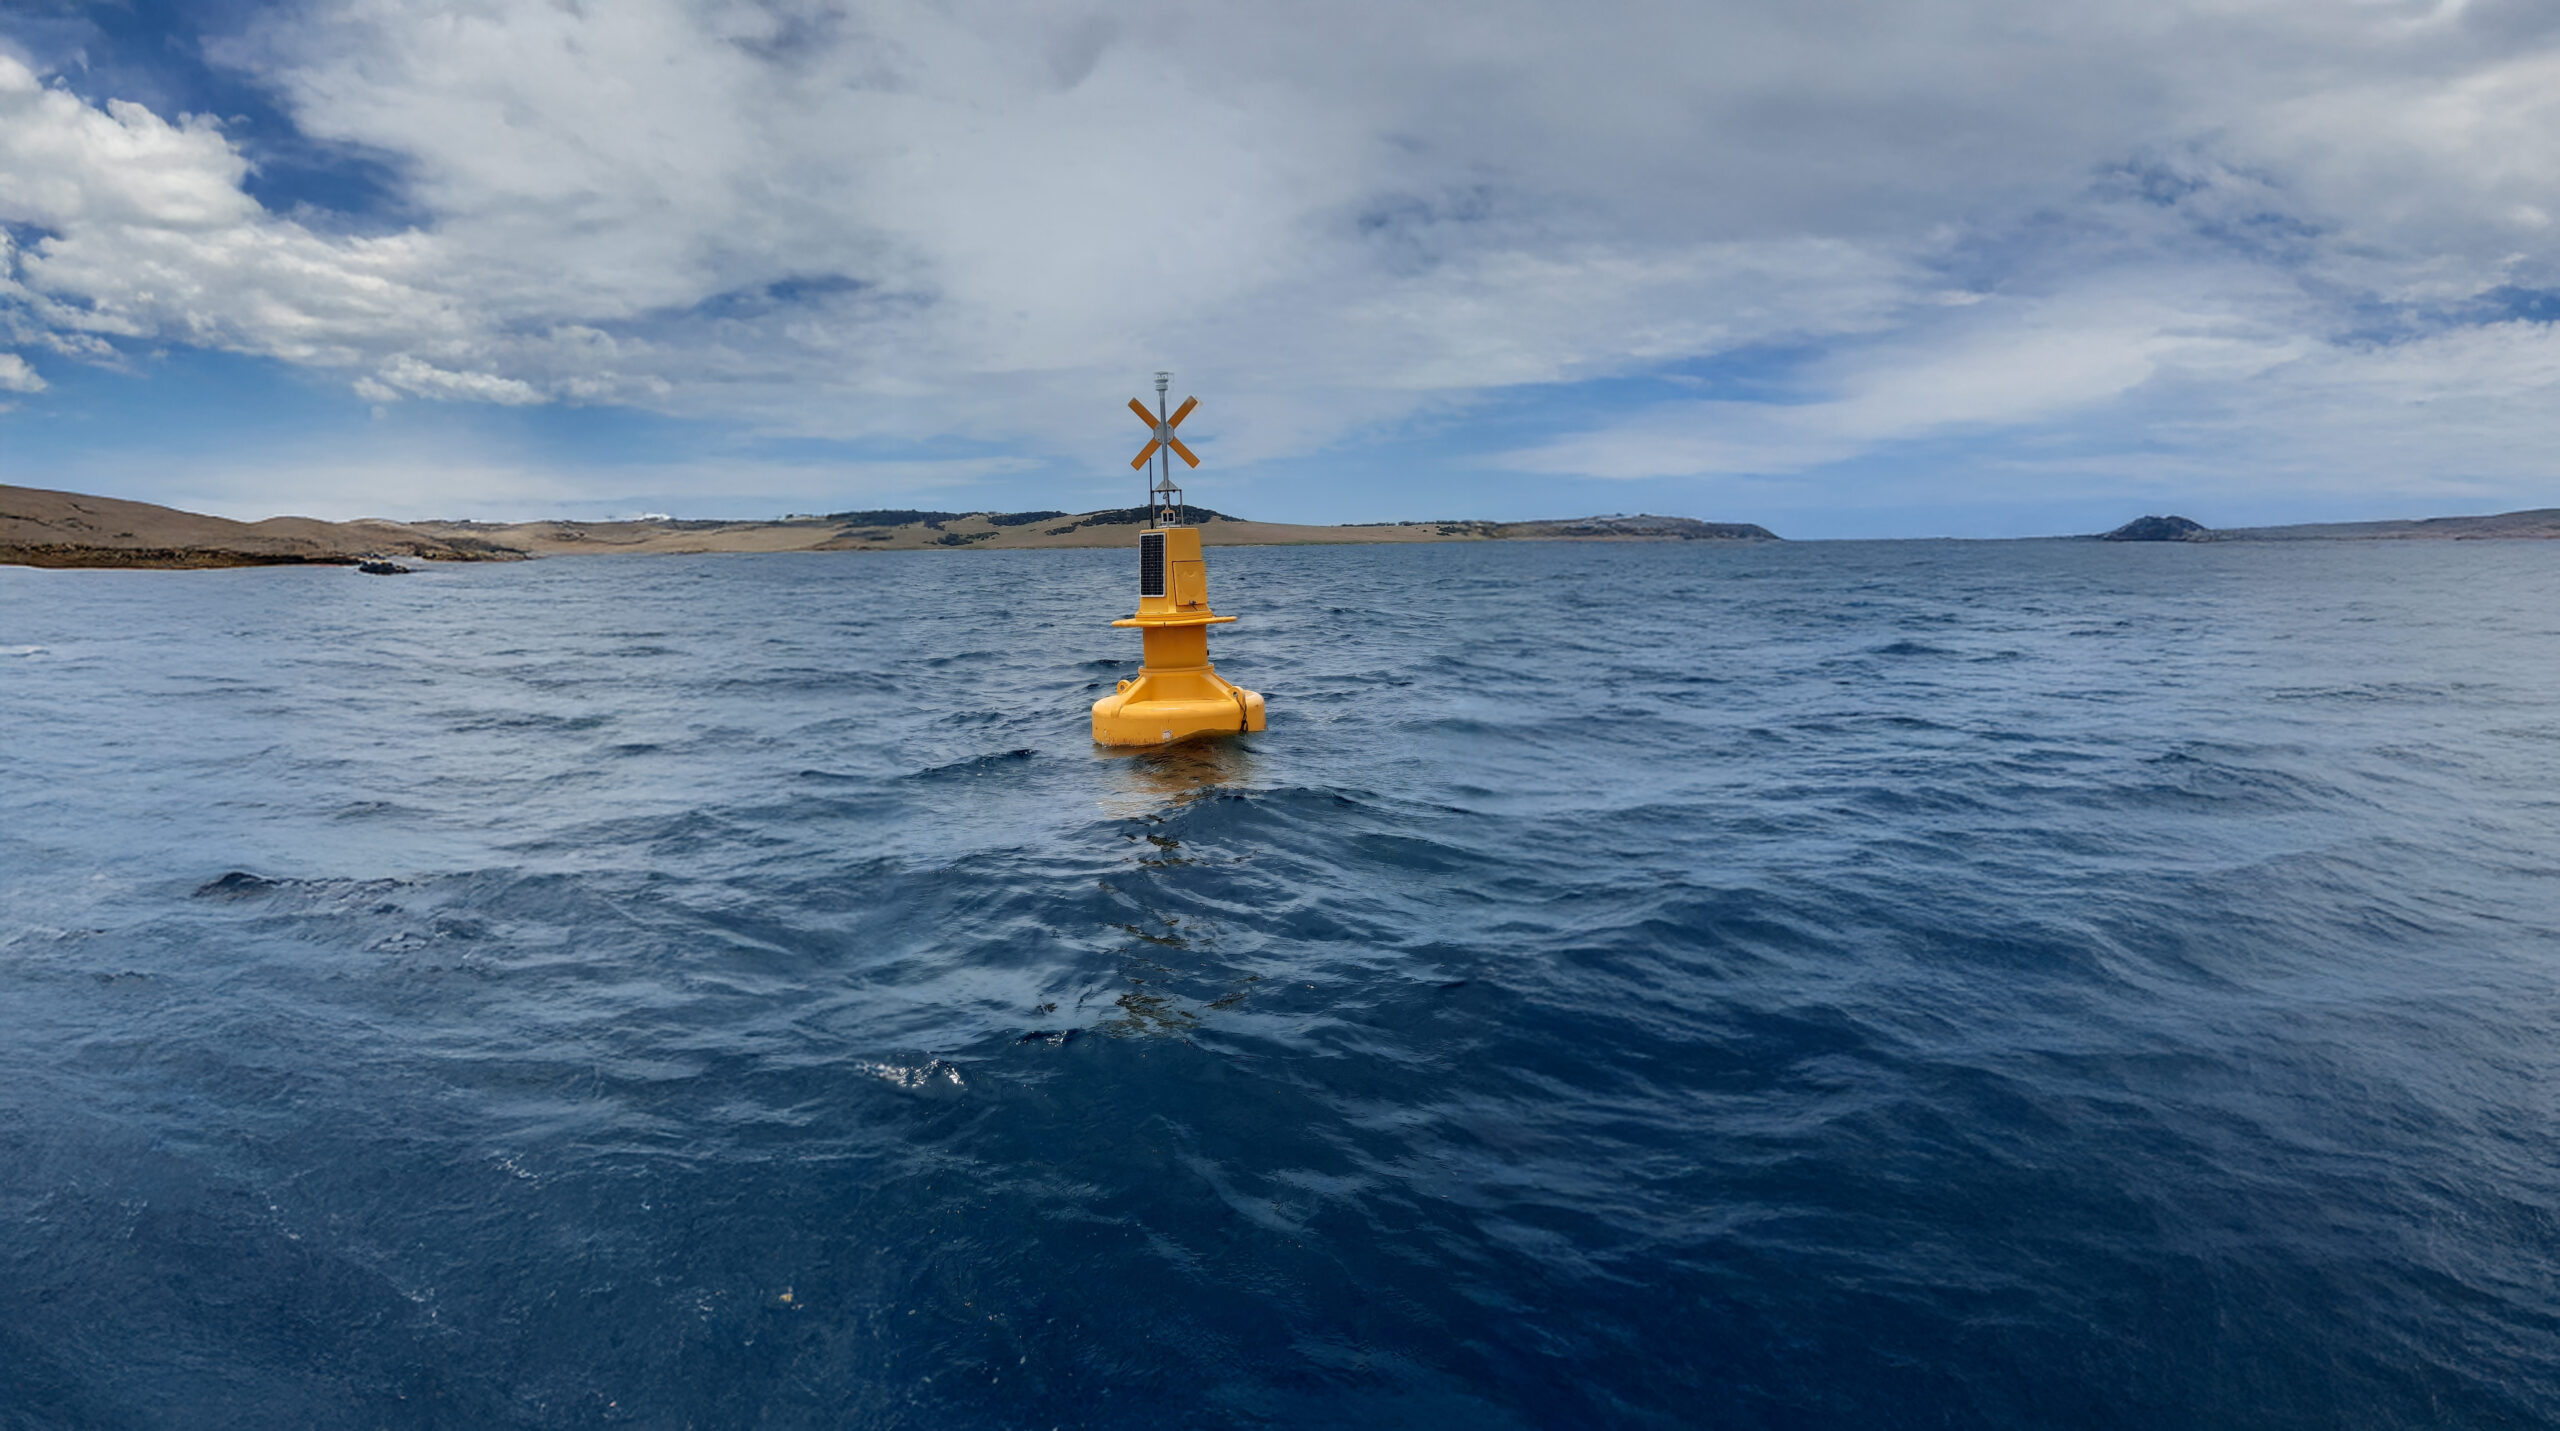
The IMOS Event Based Sampling sub-Facility uses Ocean Gliders to monitor marine events in Australian coastal waters, with up to eight deployments per year. Targeted events that IMOS could monitor include marine heatwaves, river outflows due to floods, marine cold spells, harmful algal blooms and extreme weather events such as tropical storms and cyclones. Data is transmitted from Ocean Gliders in near real-time and available through the IMOS Australian Ocean Data Network.

Why it’s important
As our oceans continue to change at unprecedented rates, the data collected by IMOS is increasingly important in helping to understand the state and trends of our environment.
The impact of natural disasters currently cost the Australian economy at least $38 billion per year and is projected to rise to $73 billion per year by 2060. However, the environmental impacts are incalculable.
The ability of Ocean Gliders to provide high-resolution temporal and spatial observations of sub-surface ocean temperature and their relative portability make them a valuable tool for monitoring marine events. The ability to measure temperature but also key bio-physical variables (including oxygen, chlorophyll, salinity) aids in understanding the dynamics of these extreme ocean events and their potential impacts on the marine environment.
Key data streams
Select a key data stream to view all IMOS Facilities that collect that data.
Useful information
Why do we need additional observations?
Marine heatwaves can be detected at the surface through remote sensing but understanding their subsurface extent in near real time is limited. There are regions in which cloud cover may be high and prevent an accurate understanding of the thermal anomalies over a broad coastal extent, or regions where the extremes temperature anomalies are restricted below the surface.
Similarly, other extreme events (flooding, cyclones, algal blooms) have features that extend well below the sea surface. The best way to observe and understand these events is to collect high-resolution data throughout the water column, across time and space – something that ocean gliders are uniquely capable of.
Why do we care about marine heatwaves?
Marine heatwaves are extreme ocean climate events characterised by anomalously warm ocean temperatures that are prolonged in duration and extend over broad oceanic and coastal regions. A warming global climate and subsequent increase in ocean heat content will increase the frequency and potentially the severity of marine heatwaves, with significant ecological implications for species mortality, modification of species geographic range preferences and impacts on critical life history stages.
How do we target the deployment of gliders?
IMOS has set up a national steering committee who meet monthly to discuss a list of priority indicators, data sources, and tools for monitoring marine events through their growth, peak, and decay phases. The committee reviews and evaluates available evidence and indicators to assess the likelihood of marine events and the likely geographic regions to be impacted.
The committee develops a set of principles to aid in the prioritisation of the potential deployment locations and their timing of eight IMOS Ocean glider deployments per annum. This prioritisation is based on criteria including:
- predicted impacts including ecological consequences,
- gaps in our knowledge of the underlying processes,
- scientific novelty of the marine event,
- likely scale of potential events in both space and time,
- the potential consequences for fisheries, aquaculture and other industries, as well as the broader community,
- accessibility to facilities to enable deployment,
- the availability of existing and supporting meteorological and oceanographic observations and models.
Glider deployments
IMOS Event Based Sampling gliders have collected measurements during marine events in a diverse range of environments around Australia.
Further information on the glider deployments is provided at IMOS OceanCurrent’s Glider webpage.
FY24/25
#1 Tasmania East Coast – TasEastCoast20241031
31 October – 24 November 2024
#2 Forster NSW – Forster20241128
28 November – 3 December 2024
#3 North-west Western Australia – Onslow20241119
19 November – 11 Dec 2024
#4 North-west Western Australia – Onslow20250129
29 January – 30 January 2025
#5 Ningaloo, Western Australia – Ningaloo20250129
29 January – 5 February 2025
#6 North-west Western Australia – Onslow20250225
25 February – 19 March 2025
#7 Ningaloo, Western Australia – Ningaloo20250402
2 April – 15 April 2025
#8 South Australia – PortLincoln20250529
29 May – 16 June 2025
FY23/24
#1 Tasmania East Coast – TasEastCoast20231207
7 December – 10 December 2023
#2 Central Great Barrier Reef- MissionBeach20240120
20-25 January 2024
FY22/23
#1 Cooktown20221117
17 Nov – 06 Dec 2022
#2 West Coast Tasmania – TasWestCoast20230405
5 April – 1 May 2023
FY21/22
#1 Weipa, Gulf of Carpentaria – Weipa20211123
23 November – 29 November 2021
#2 Tasmania East Coast – TasEastCoast20220311
11 – 20 March 2022
#3 Central GBR – MissionBeach0220220126
26 January – 22 February 2022
Regular (double deployment) Central GBR – MissionBeach0120220126
26 January – 2 February 2022
#4 Tasmania East Coast – TasEastCoast20220311
11 – 20 March 2022
FY20/21
#1 Jurien Bay to Geraldton, Western Australia – JurienBay20210122
22 January – 17 February 2021
#2 East Coast Tasmania – TasEastCoast20210309
9 March – 30 March 2021
#3 Southeast Tasmania – StormBay20210415
15 April – 11 May 2021
#4 Offshore GBR – LizardSlope20210317
16 March – 11 April 2021
FY19/20
#1 Central Great Barrier Reef – GBR20200123
27 February – 27 March 2020
#2 Southern Great Barrier Reef – CapricornBunker20200307
7 March – 20 March 2020
#3 Kimberley/ Rowley Shoals – RowleyShoals20200506
6 May – 5 June 2020
FY18/19
#1 East Coast Tasmania – TasEastCoast20190213
13 February – 9 March 2019
#2 East Coast Tasmania – TasEastCoast20190316
16 March – 11 April 2019
Essential Ocean Variables / Essential Climate Variables
This sub-Facility contributes to 9 Essential Ocean Variables and 8 Essential Climate Variables.
EOVs: Ocean surface heat flux, Oxygen, Particulate matter, Phytoplankton biomass and diversity, Sea surface salinity, Sea surface temperature, Subsurface currents, Subsurface salinity, Subsurface temperature
ECVs: Ocean surface heat flux, Oxygen, Plankton, Sea surface salinity, Sea surface temperature, Subsurface currents, Subsurface salinity, Subsurface temperature
Contact
Prof. Charitha Pattiaratchi
E: chari.pattiaratchi(at)uwa.edu.au
Operating institution
Subscribe to our newsletter
Facility updates, new data streams, user resources, impact stories, and research findings direct to your inbox.
Explore Facilities
Acknowledging IMOS
Users of IMOS data are required to clearly acknowledge the source material by including the following statement:
Australia’s Integrated Marine Observing System (IMOS) is enabled by the National Collaborative Research Infrastructure Strategy (NCRIS). It is operated by a consortium of institutions as an unincorporated joint venture, with the University of Tasmania as Lead Agent.