
An Argo float (WMO ID 3902460) has been trapped in an anticyclonic eddy propagating through the Great Australian Bight for over one year to date (Figure 1). The float was first entrained by the eddy in 7 August 2024 (cycle 60, Fig 2a) and did three full loops at the eddy periphery before settling into the eddy core (Fig 2a, float track in red). Since entraining the float, the eddy moved westwards, from 130.8°E, 36.2°S to 120.2°E, 37.2°S, at a speed of ~3 km per day.
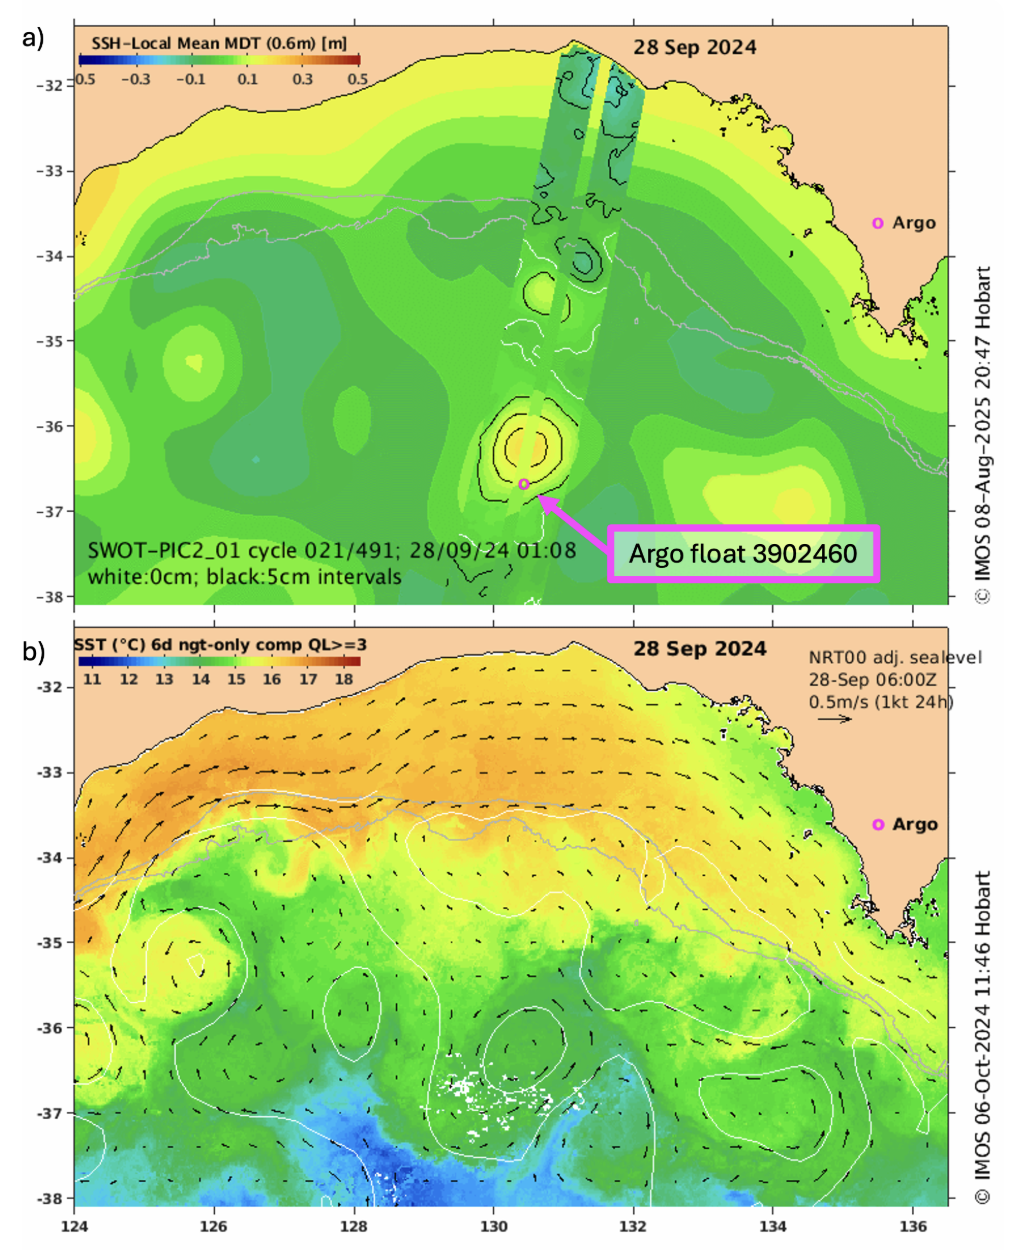
Figure 1: a) Map of adj. sea level anomaly from the IMOS-OceanCurrent GSLA product overlaid by adj. sea level anomaly measurements from SWOT right over an anticyclonic eddy in the Great Australian Bight that has entrained an Argo float for over one year to date; b) Map of SST overlaid by geostrophic velocities calculated from GSLA (black arrows). Both figures are for 28 Sep 2024.
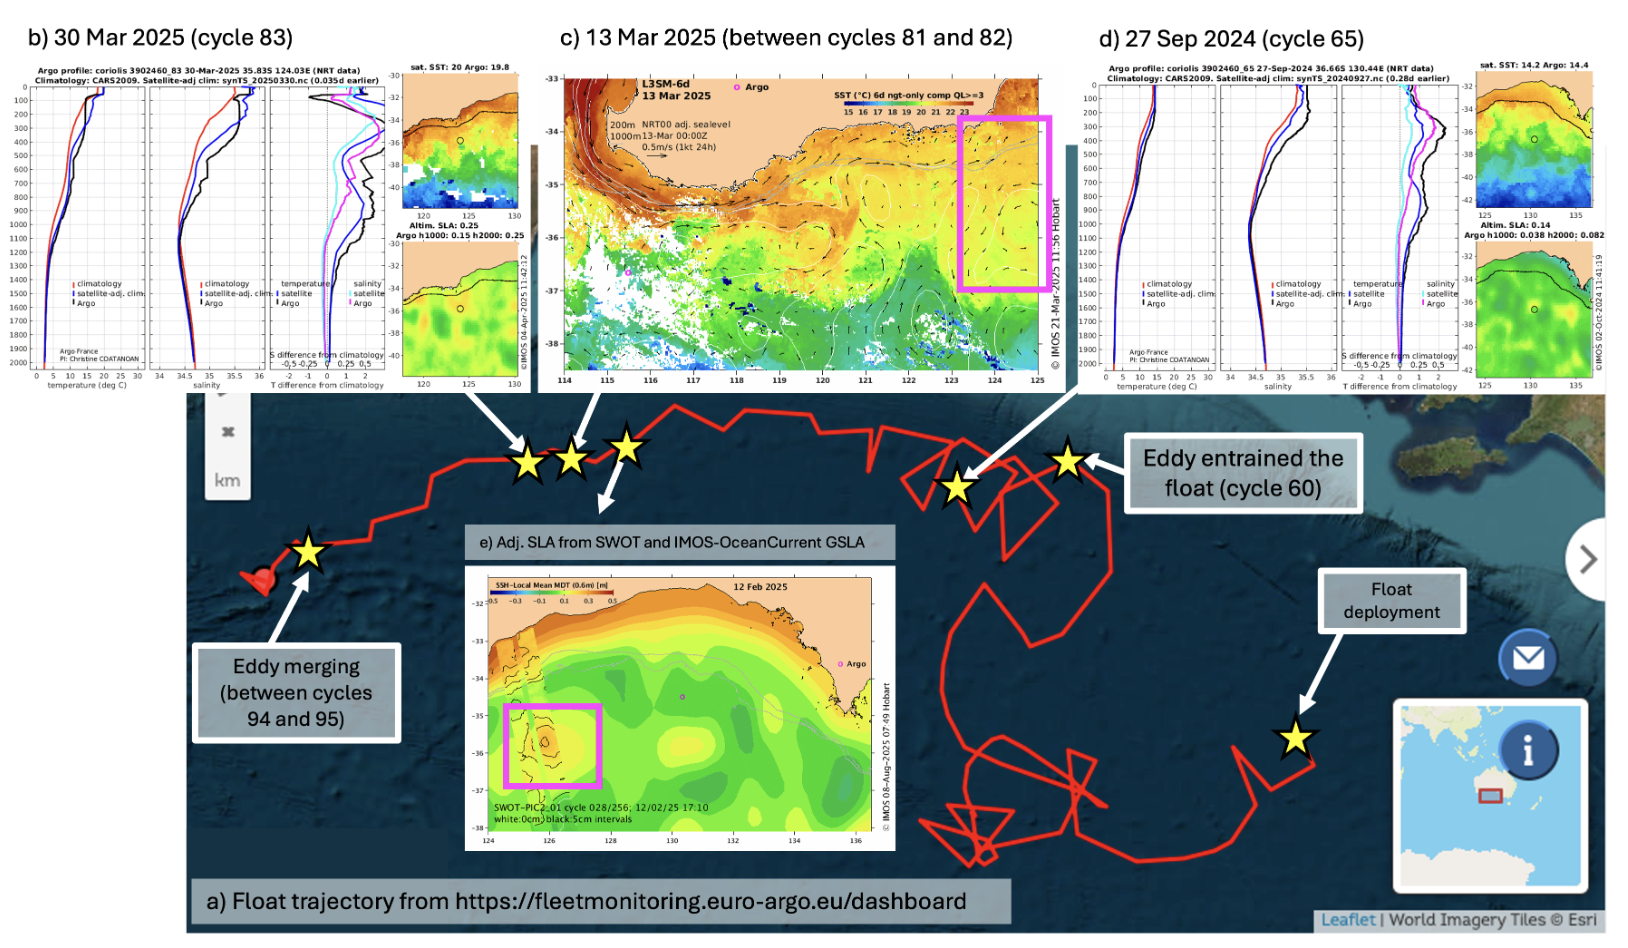
Figure 2: Trajectory of Argo float 3902460 in the Great Australian Bight with key events related to the eddy & float combo indicated by yellow stars. The float is moving from east to west.
Over the past year, the float measured 37 profiles (one every 10 days) of temperature (T) and salinity (S), with some of these profiles having an interesting pattern. On 27 Sep 2024 (cycle 65, Fig 2d), for example, the float measured a mid-depth T anomaly maximum at ~900 m, with waters 1°C warmer than the satellite-adjusted climatology. Mid-depth anomalies become more evident as the eddy propagates, and some of the T and S profiles have a ‘staircase’ pattern, evident in cycle 83 (Fig 2b), with large anomalies at 350 and 700-950 m. This and later cycles also show high values of T and S well mixed in the top 60 m (top-400 m zoomed in here). This warm and salty mixed layer indicates the entrainment of coastal waters in the near-surface of the eddy. Maps of SST from March, 2 weeks before cycle 83, show a filament of warm water extending from the coast to the open ocean in the western flank of the eddy (Fig 2c, pink box), being advected by the eddy rotation.
The mid-depth maxima in T and S measured within the eddy are similar to the ones we’ve described before in eddies in the Tasman Sea. The profiles suggest that the eddy that trapped this float is a lense – an eddy that had its core subducted over time, and another water mass was trapped above its original core.
Lense-type eddies are observed in maps of adj. SLA, but often don’t have a SST signature. Fig 1 confirms that this eddy is indeed a lense: the eddy keeps a strong SLA signal and often a well defined shape (Fig 1a, beautifully captured by SWOT), with no clear signal in SST maps (Fig 1b). We see this eddy in the Adj. SLA maps because the eddy is in geostrophic balance (i.e., surfaces with different water densities maintain the circular flow, and vice-versa), and altimetry measurements capture the imprint of this flow in the free surface of the ocean. Having said that, the eddy’s rotation advects water meridionally, bringing cold waters to the north, and hot waters to the south. In frontal regions, the T contrast between waters is seen as filaments within the eddy, for example in the coastal entrainment from March described above (Fig 2c).
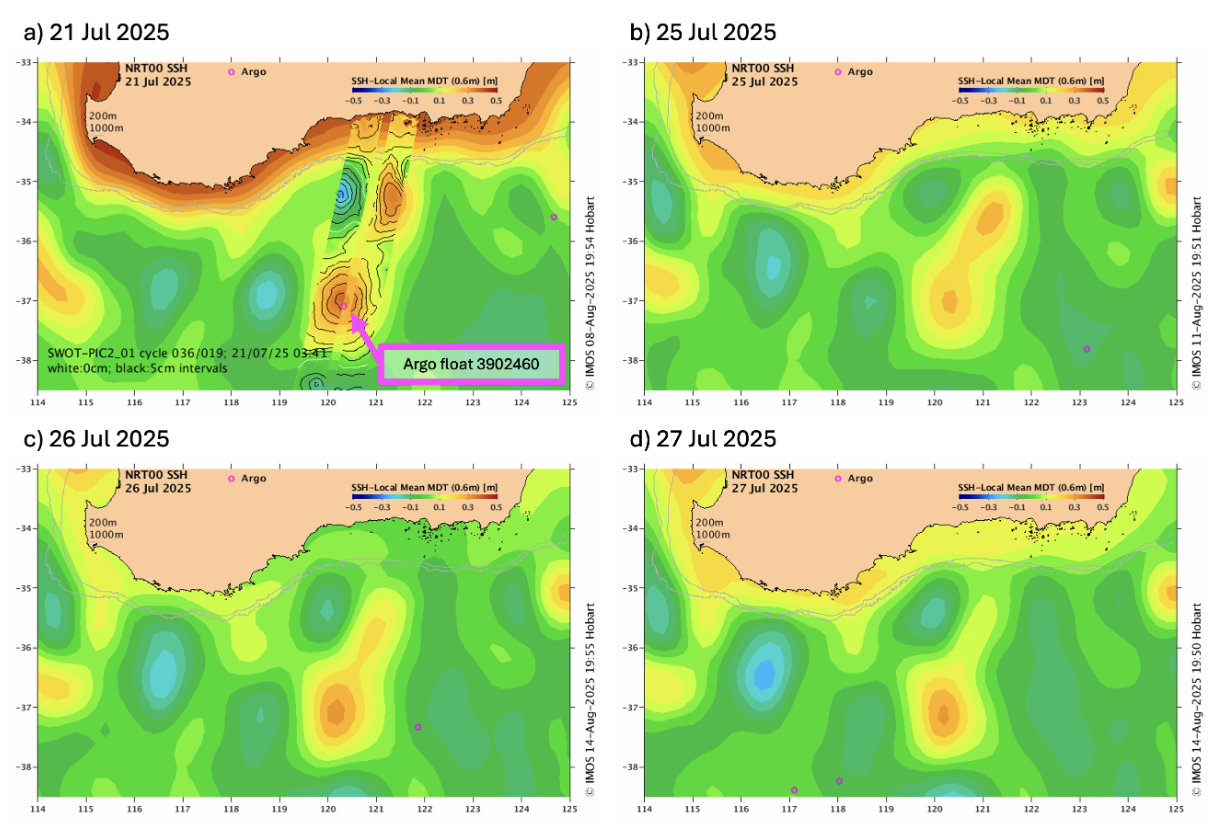
Figure 3: Maps of adj. sea level anomaly from the IMOS-OceanCurrent GSLA product showing the merge of two anticyclonic eddies south of Bremer Bay (~120°E); (a) has adj. SLA measurements from SWOT showing the two anticyclones before merging.
Written by Gabriela S. Pilo