IMOS has launched the beta release of IMOS Live, a web-based application designed to provide streamlined access to Australia’s marine data.
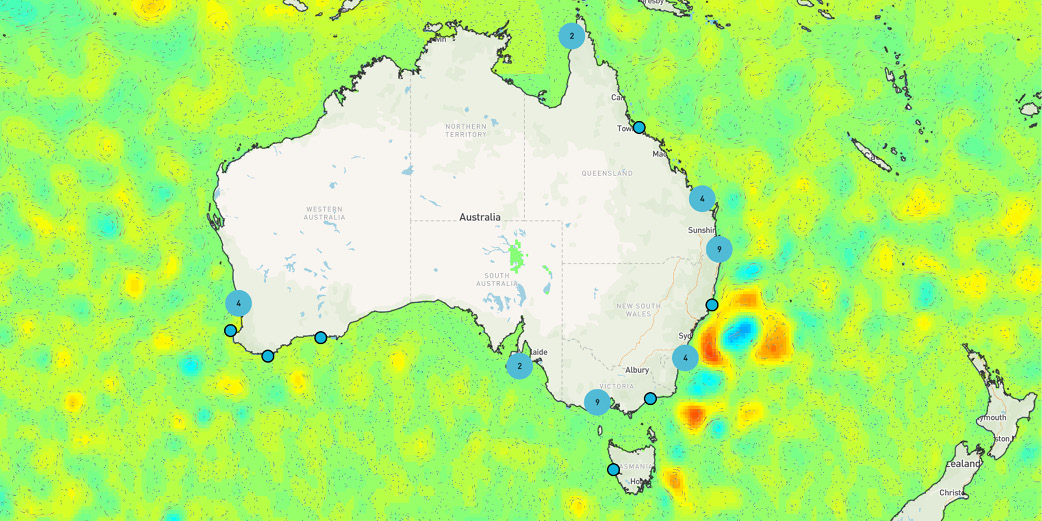
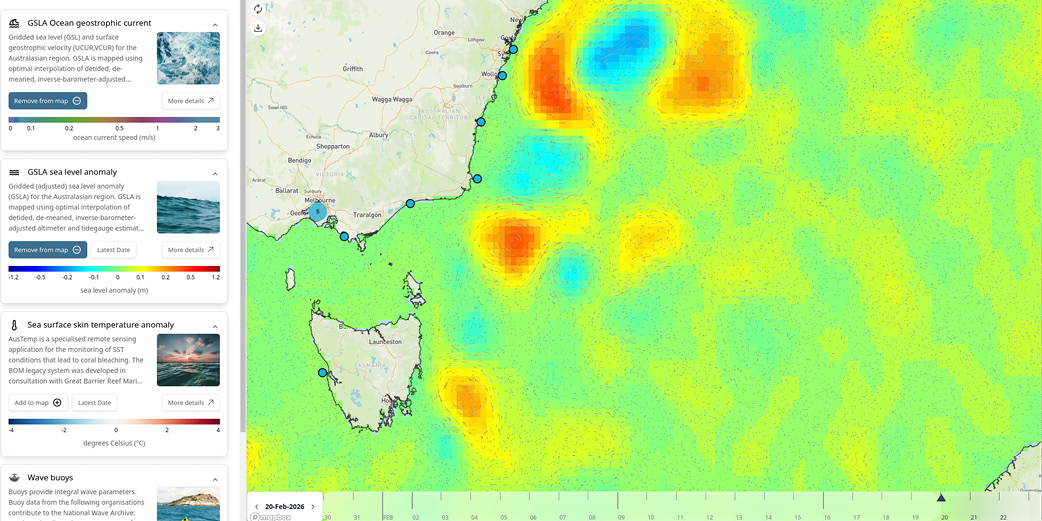
The platform serves as a central hub for viewing Near Real-Time (NRT) IMOS products, including satellite-derived data, wave data from buoys and more, offering a practical tool for researchers, government managers, and the broader oceanographic community.
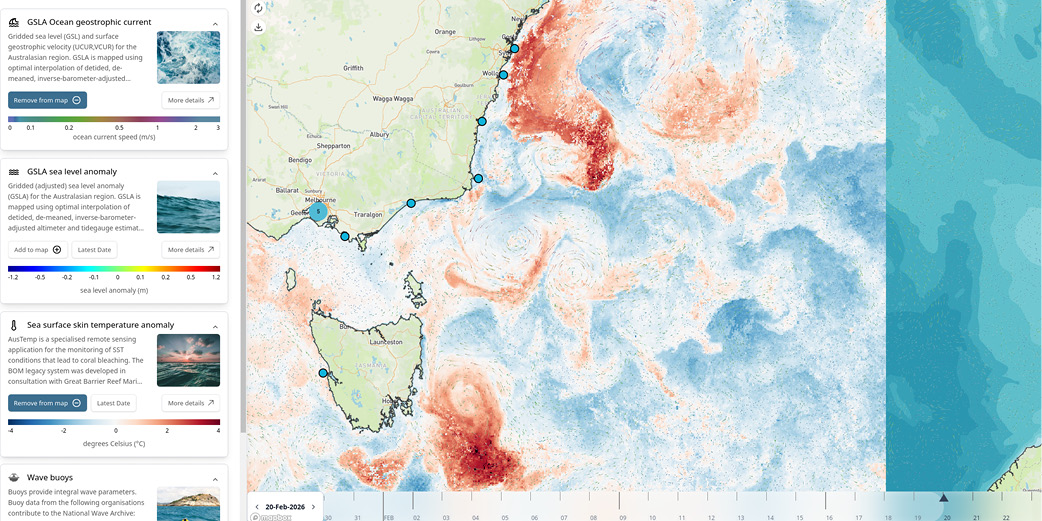
One of the primary advantages of IMOS Live, is its ability to facilitate the joint visualisation of spatial satellite imagery with point-source time-series data. This allows users to directly compare broad-scale environmental patterns with specific observations from wave buoys and moored instruments.
To support field operations and on-site monitoring, the interface is optimised for mobile devices and small screens, ensuring that users can access reliable data while working in the field.
Furthermore, the application includes a feature for downloading map views as PNG files, making it simple to incorporate high-quality visualisations into technical reports, academic publications, and presentations.
“The IMOS Live website visualisations allowed me to study the strength of the ocean currents around the coral atolls of the Coral Sea that I am mapping for Parks Australia. These visualisations helped me to understand the relationship between the strength of the flows and the geomorphology of the reefs.”
Eric Lawrey, Knowledge Systems Manager, Australian Institute of Marine Science
As we move beyond the initial beta launch in mid-March, we intend to significantly expand the platform’s capabilities. Future updates will include integrating additional data layers, such as AusTemp Degree Heating Days (DHD), and marine heatwave tracking indicators. We also plan to broaden our data reach by incorporating an expanded national array of wave buoys and additional data from the national mooring reference stations network.
These ongoing developments aim to provide a more comprehensive and accessible view of Australia’s state of the ocean. We encourage all interested users to explore the platform during the beta phase and look forward to your feedback as we continue to refine this resource.